
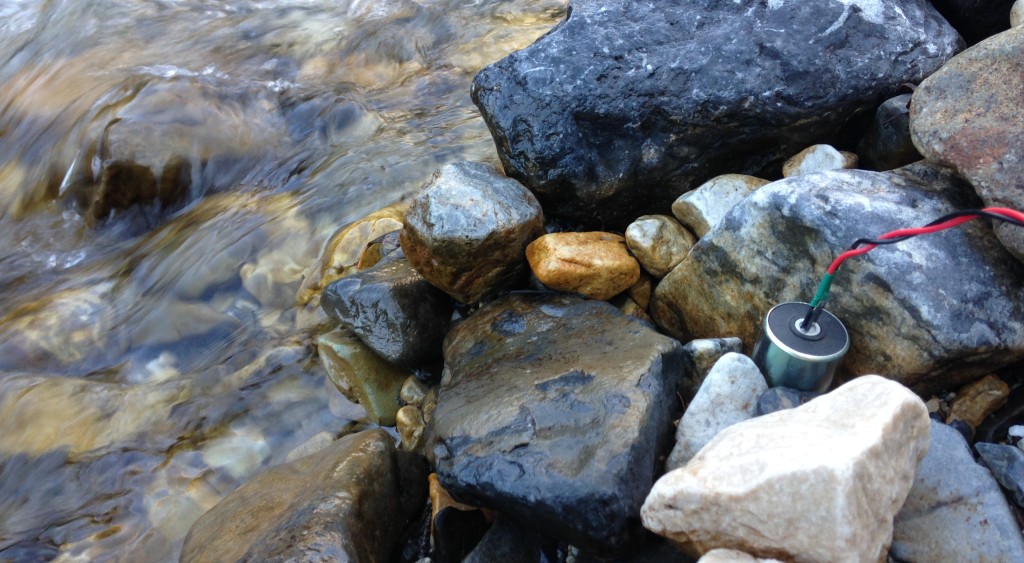
Last year I created the seisMeowmeter project which unfortunately didn’t see full completion and so it collected dust as a prototype while I continued on with other projects. However, while building the seisMeowmeter, the geophone showed me that the ground was, in a way, a lot like jello than something completely rigid. The geophone picked up footsteps from upstairs, it picked up cars driving by my house and it even picked up the tiny vibrations that were coming from the transformer in my oscilloscope. The fact that the ground could transfer movements over a considerable distance was something very, very profound to me.
Given how amazed I was over what a small can with a magnet inside could do, it persisted in residing in a spot in my mind as I worked through other projects. I couldn’t let this one go and I just had to do something more with it.
What I really wanted to do was to take the seisMeowmeter with me wherever I went. All of seismic recording that was previously done was either indoors or in very close proximity to my house. The setup wasn’t very portable and all of the graphical output was done over the web which is great if the seisMeowmeter stays in one spot with internet access. I wanted to be able to take the seisMeowmeter hiking with me where there was no cell reception, let alone internet. I needed a local ‘scope’ on my computer to see data.
Enter, the meoWScope
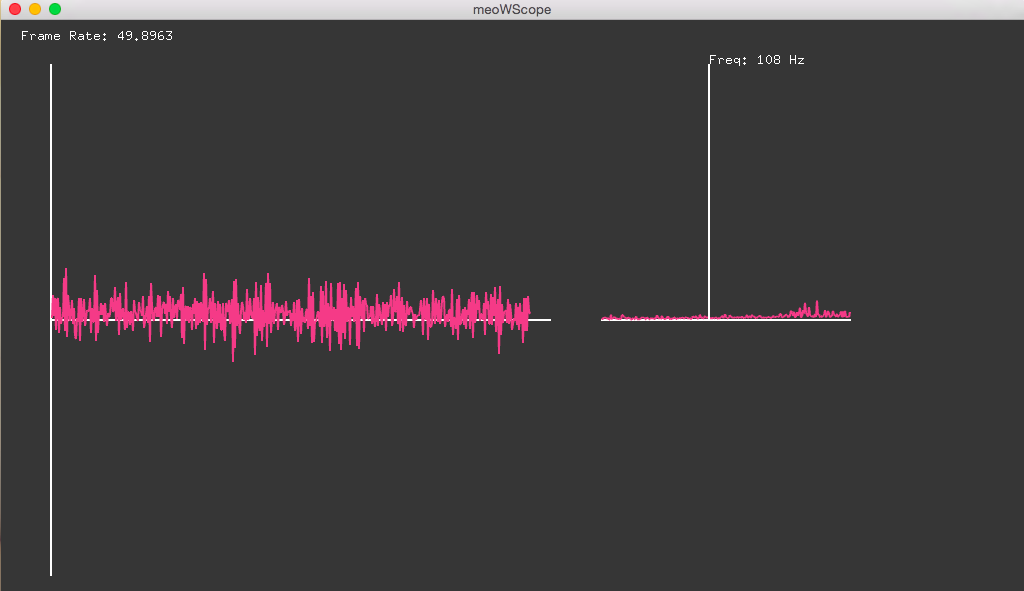
Using openFrameworks, I made a simple digital oscilloscope to show the output from the seisMeowmeter. The meoWScope is a whole topic of its own and I won’t cover it here. Instead what I will say about it is that it takes in the serial stream of data from the seisMeowmeter and shows two graphs: a time-domain waveform and a frequency spectrum. The scope has some problems that need to be sorted out but it serves as a pretty good indicator of what is happening on the ground.
On the hardware side, I simply took the breadboard prototype and transferred it onto protoboard. More details about the hardware can be found here but in short, the bottom part is the analog circuitry that amplifies and filters out the incoming signals from the geophone. The microcontroller (a dsPIC33F) is at the top and converts the conditioned analog data to digital values via 10-bit ADC. The data stream is piped through a UART line to the PC.
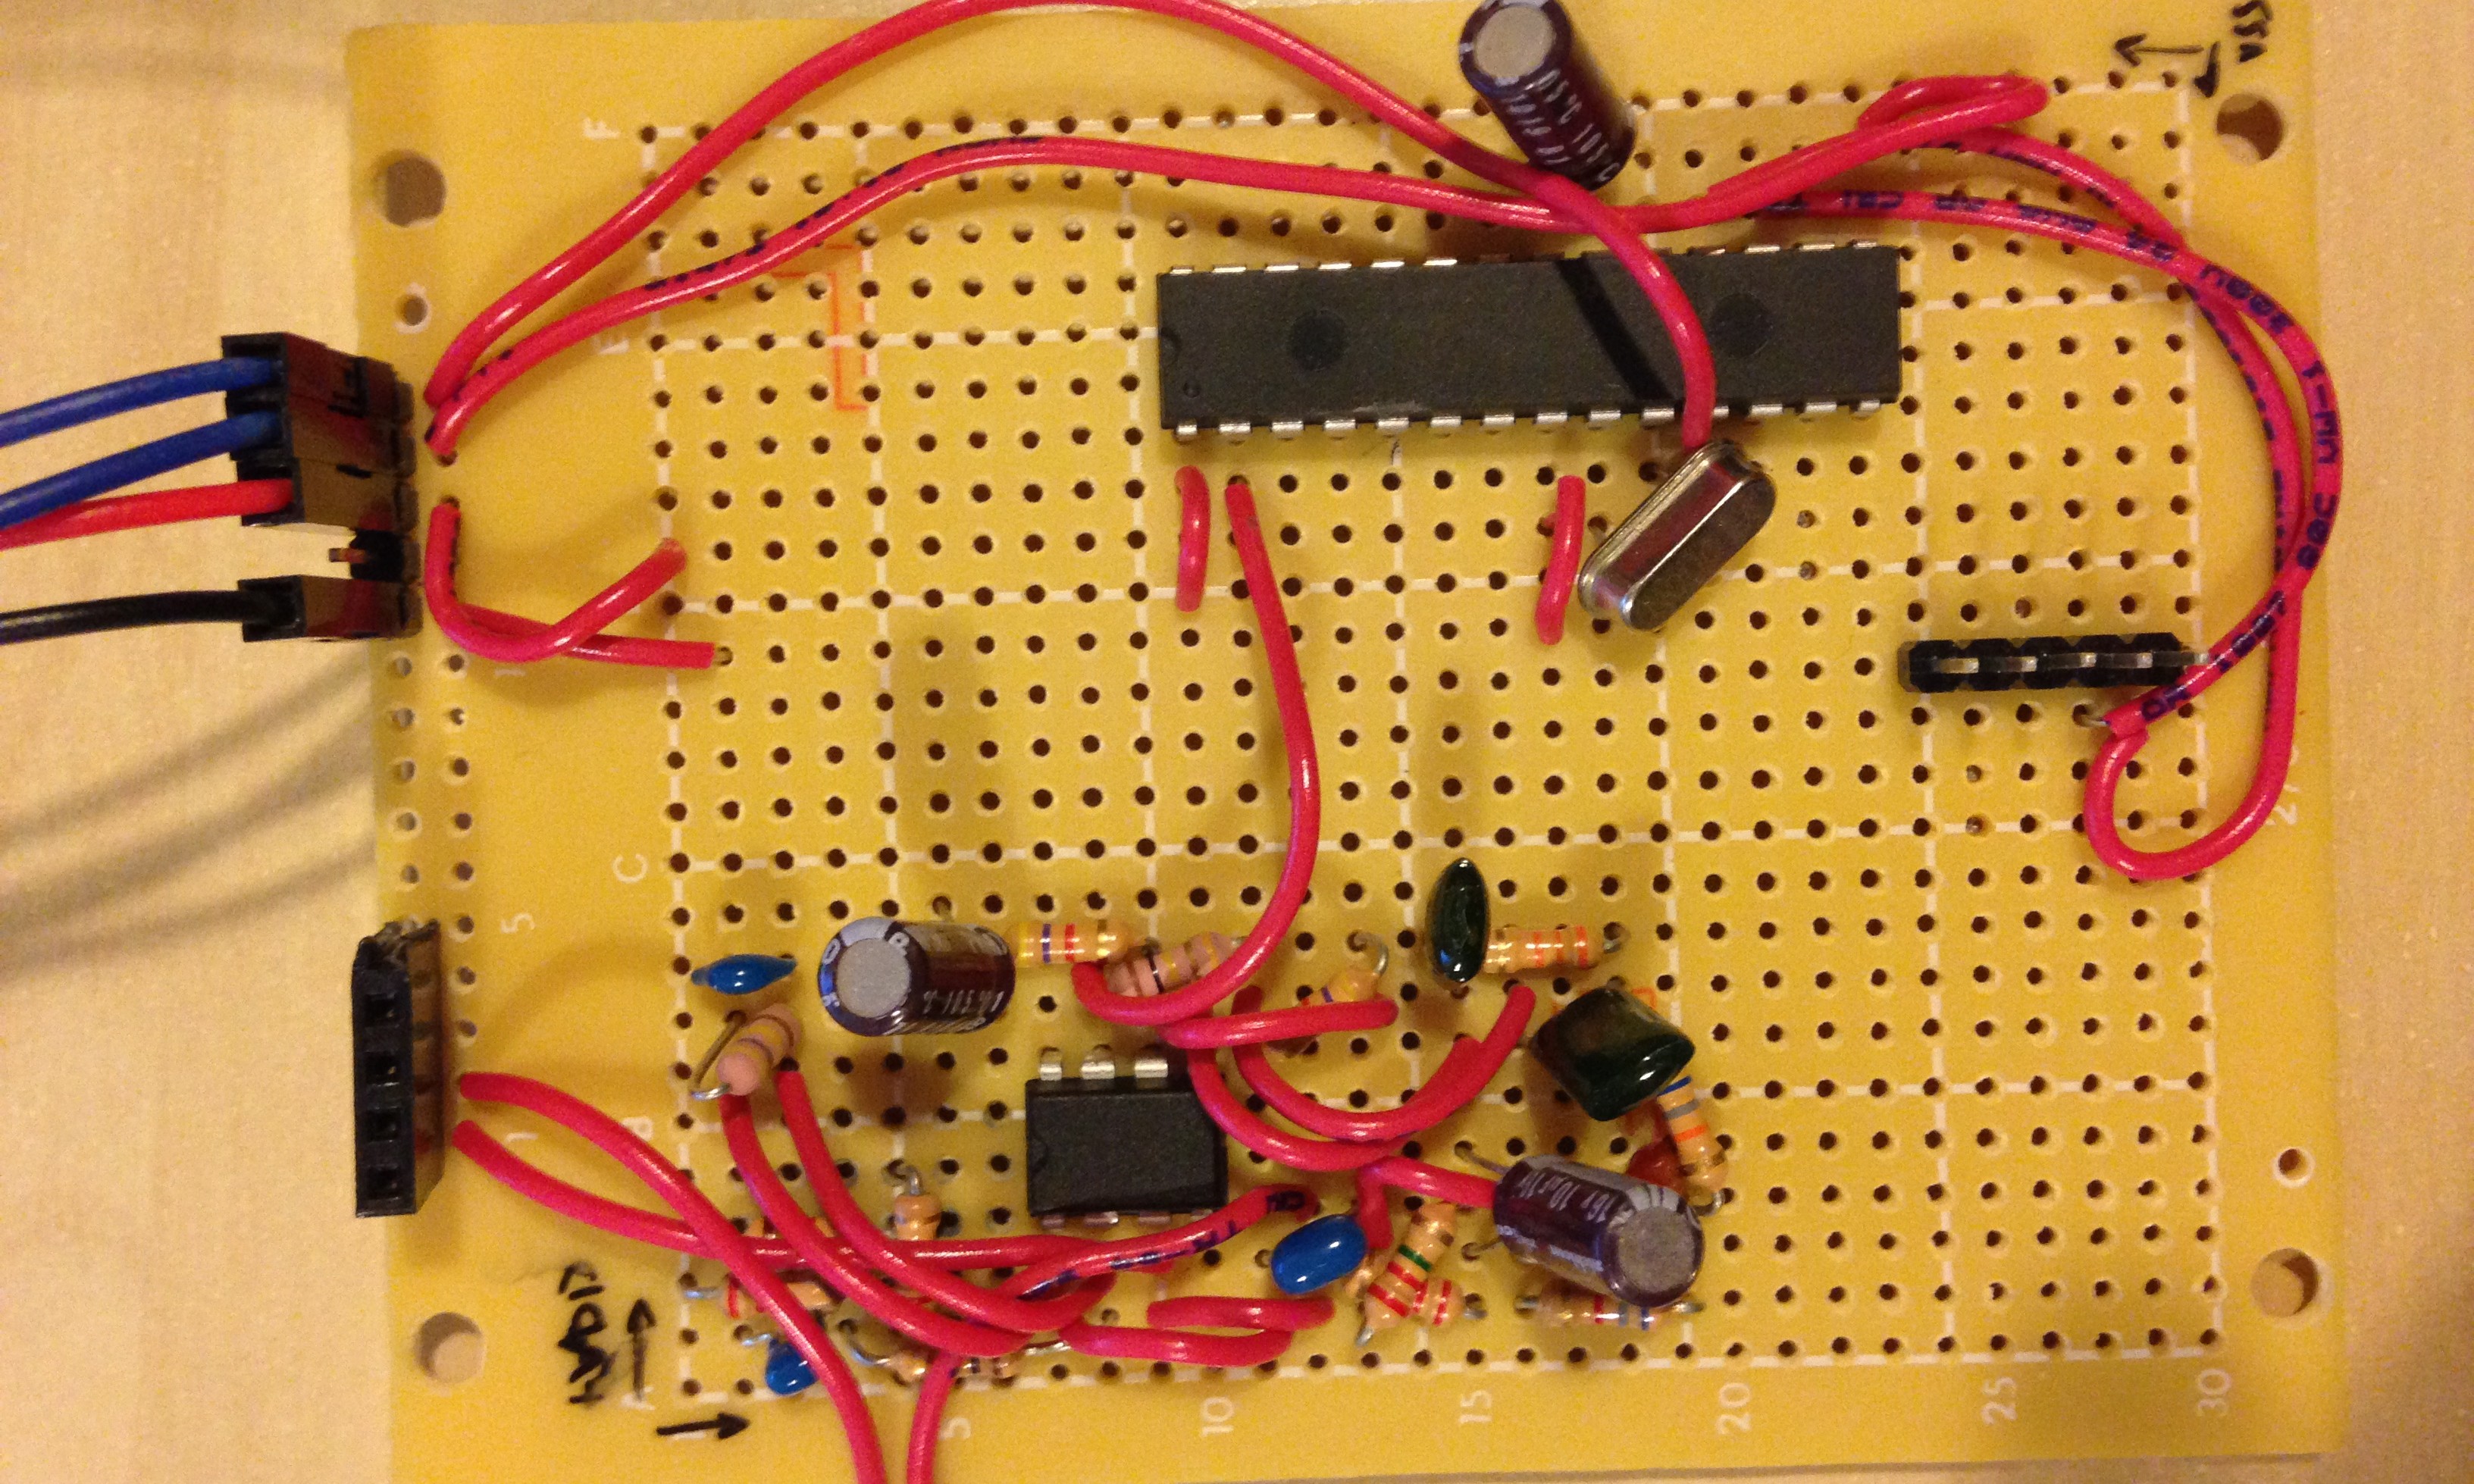
It’s not pretty but it’ll do
Now that I had a much more portable seismometer that I could carry around, it was time to try it out.
A Bridge!
One place where I was very interested in taking seismic data was a bridge. Bridges are really neat in that they are seemingly static, rigid structures on the outside. Of course this isn’t 100% the case with bridges at all. The bridge experiences some movement especially with things moving on it. With the right instrument one can see just what sort of movements go on.
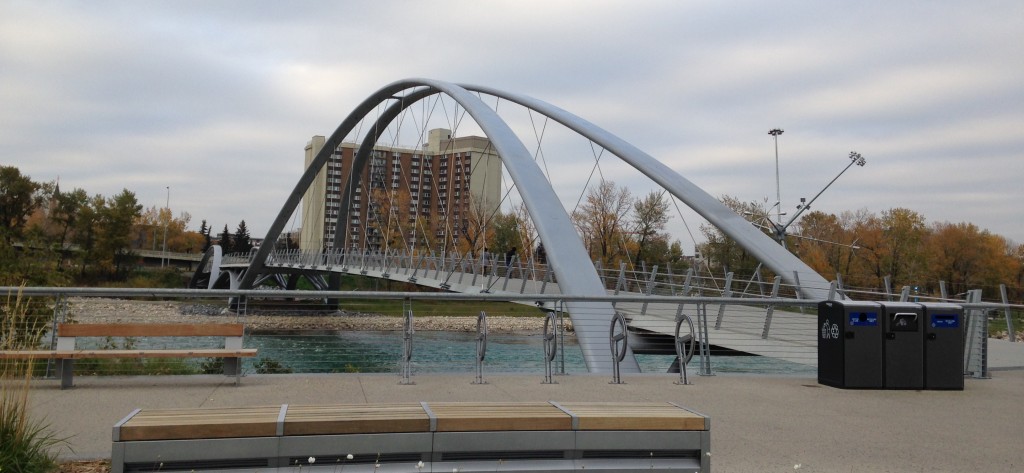
The above bridge is a pedestrian bridge that connects to a really nice island park on the river. Often, you could feel the bridge’s small motions up and down as people walked across it. It’s a common phenomenon and I’m sure nearly everyone who has walked across a bridge felt the motions at least once. These motions intrigued me enough that I wanted to measure them with my (now portable) seisMeowmeter.
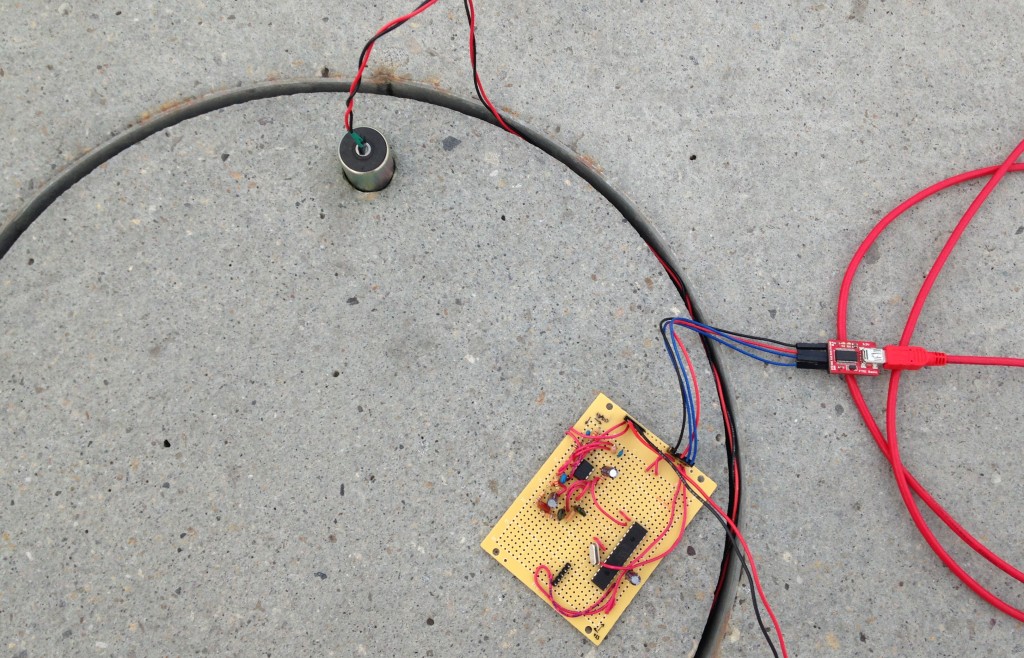
The seisMeowmeter setup. It’s like they created that hole just for the geophone!
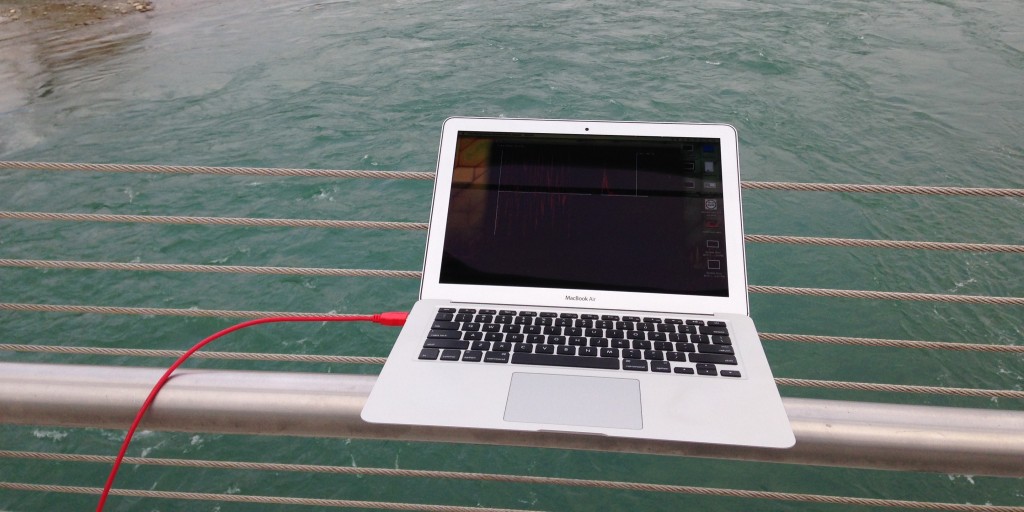
Perhaps not the best way to place a laptop…
A Note about the Measurements!
The graphs below often show large amplitudes so context is important to mention here.
The sensitivity of the geophone is 28.8 V/m/s. The geophone signals are boosted with a gain of about 1000 V/V and the amplified output is limited to +/- 1.65V (which are the amplitude limits of the graphs below). Taking the gain and sensitivity into account, the maximum ground velocity that can be graphed here is 0.048 m/w or 4.8 cm/s. So while a large amplitude on the graphs may seem like the ground is moving a lot, really it’s not moving much at all. However, this does speak a bit for the sensitivity of the geophone. The fact that it can pick up less than 5 cm/s of movement is pretty impressive.
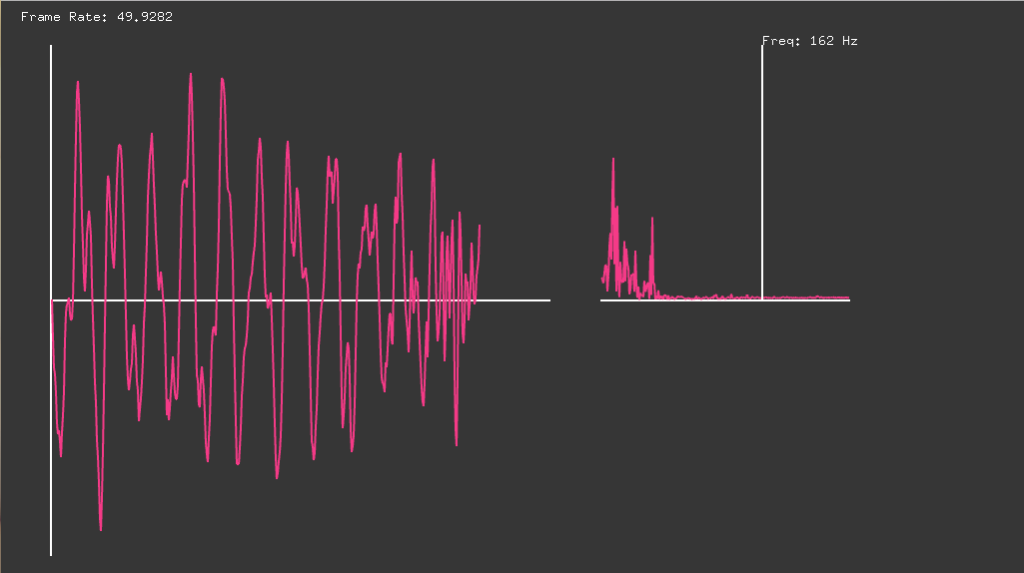
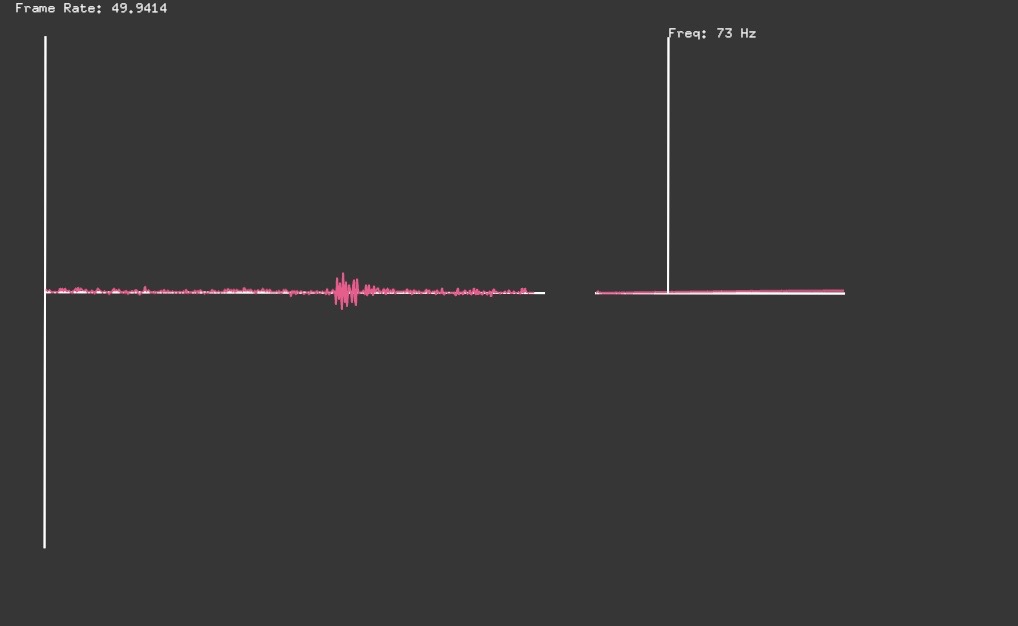
seisMeowmeter Output with Nobody on Bridge
Below is the waveform for the bridge with nobody other than myself on it. It was a pretty windy day so I imagine that the air flow contributed to some of the bridge’s movements:
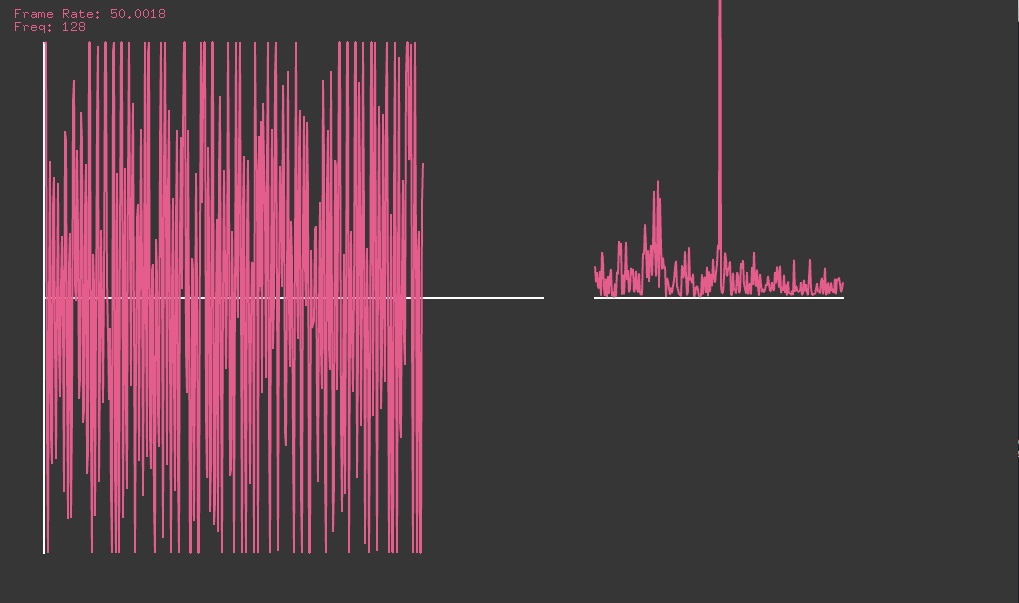
Graph of People Walking on Bridge
Below is the waveform of a number of people casually walking across the bridge. It certainly looks more active than a bridge with nobody on it:
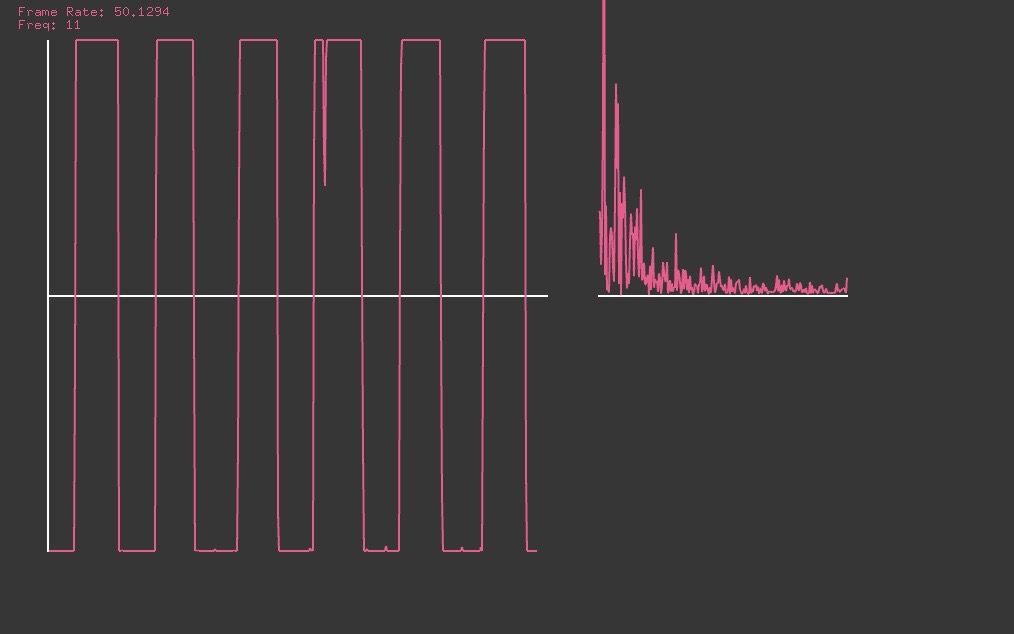
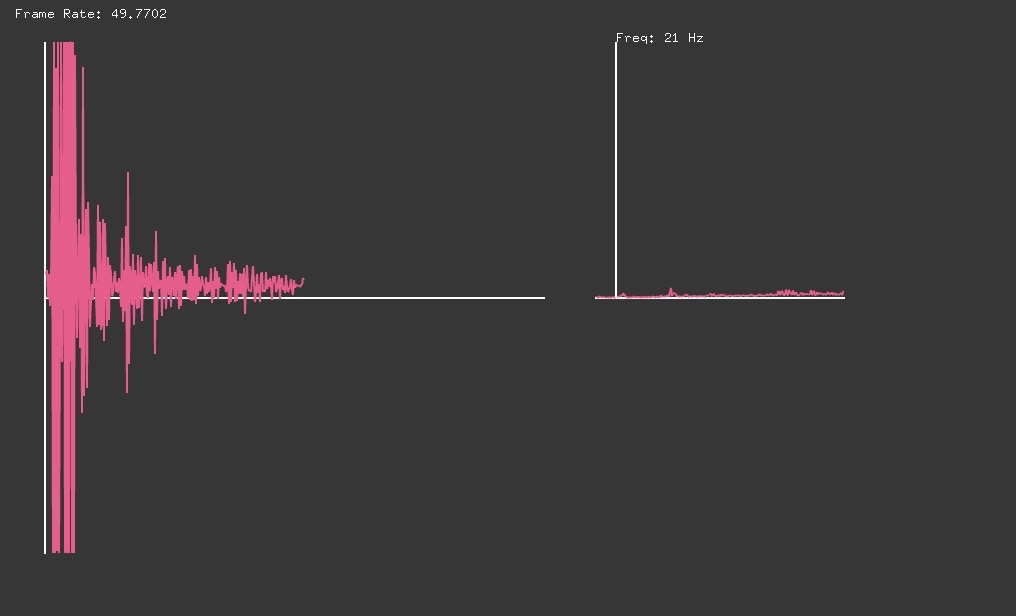
Graph of Someone Running Across Bridge
This is a waveform of a runner who ran across the bridge. Notice how the bridge moves along with the runner’s pace. Since the runner adds more downward force to the bridge with each step, the bridge moves more than if it had people just walking on it:
It was pretty neat to observe the seisMeowmeter picking up the small movements on the bridge. With that bit of curiosity fed, I wanted to take the instrument somewhere else. Somewhere out in the wild…
Hiking with the seisMeowmeter
The first trail that came to mind where I thought some interesting data could be found was in a box canyon full of scree and home to a gigantic waterfall. I was curious over what kind of waveform I would get with the geophone close to the waterfall.
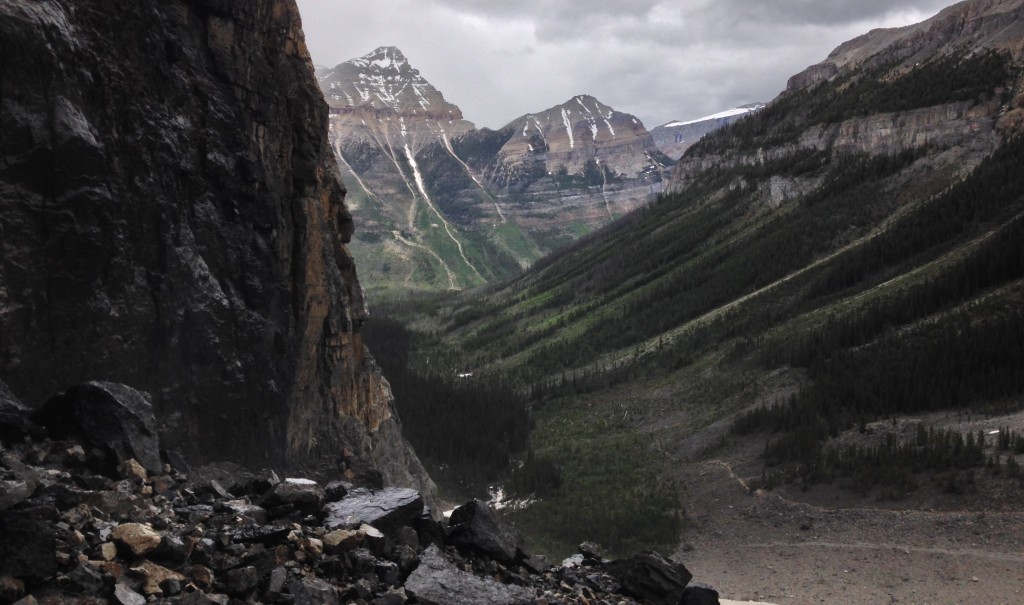
Half of this post is about putting in pretty pictures
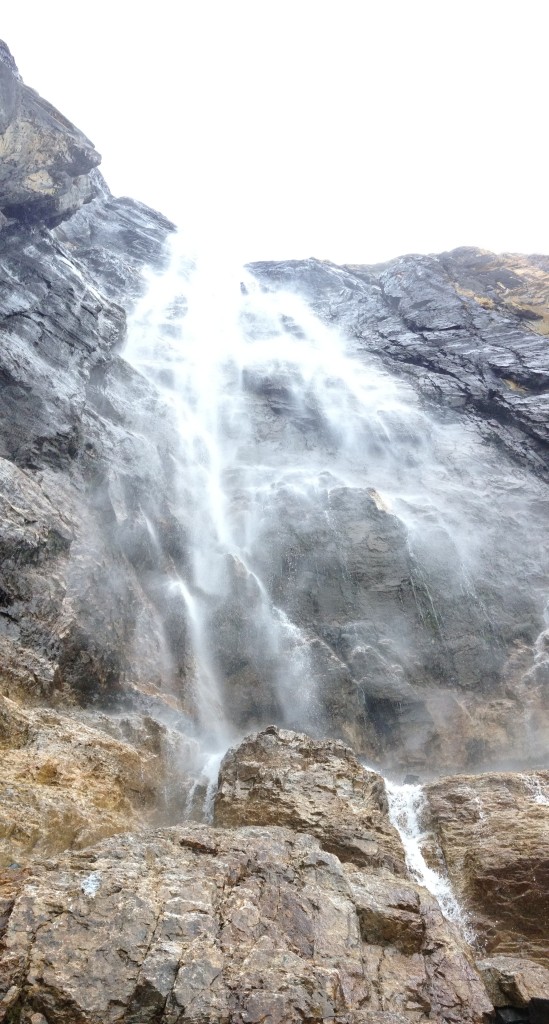
The waterfall of power (photo taken in the spring)
I was all set to head out on the trail and get some cool data. However, what I didn’t account for was the changing seasons.
Since the waterfall existed because of water from snowmelt from the winter, going much later in the season meant that there would be no waterfall or at least, some trickling of water. HOWEVER, when visiting near the winter, water tends to do this thing called freezing and the result was ice chunks falling high from the mountain walls. It was perfect – if not, a little dangerous.
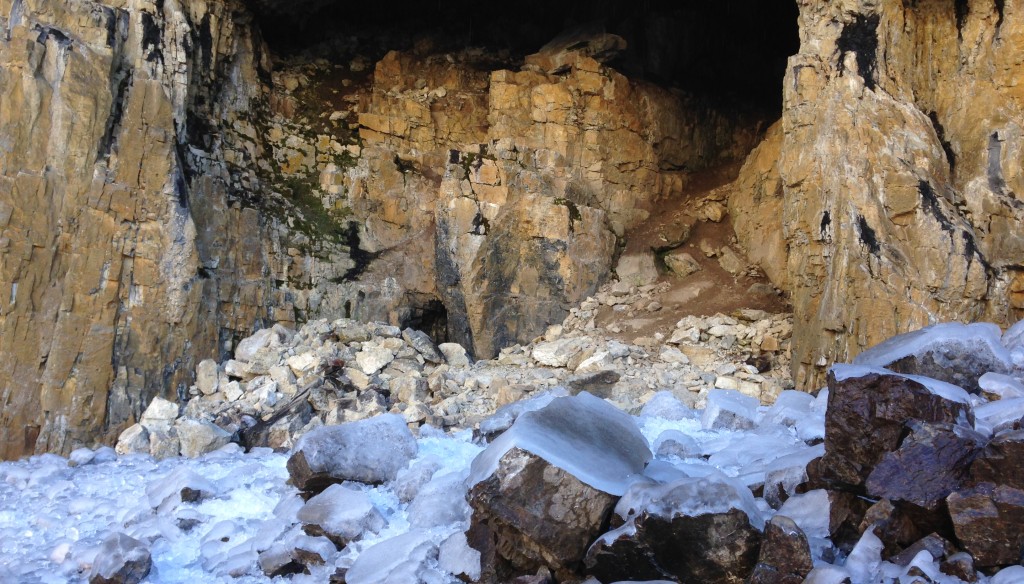
Glorious ice…and a cave!
Being careful to avoid ice falling on my head, I placed the seisMeowmeter close to where the ice was falling. The chart below shows a fairly small chunk of ice falling on the ground:
Much time was spent watching little blips of ice falling
This chart shows what happens when a group of large ice bits fall:
It was a good idea to stay well away from the ice drop zone
Below is a video giving a pretty good demonstration of the geophones sensitivity as my girlfriend jumps up and down from a distance of about 10 or so metres away. I keep saying “all the way over there” but really, she’s not that far away. Still, the sensitivity is pretty impressive.
Ending Notes
I love working with sensors. They’re a constant reminder to me that some of the most amazing things about the world (and universe) can literally be beneath your feet. Have the right instrument at hand and you can learn something. The seisMeowmeter was a great tool for me to see just how movements can travel on the ground. In college, I was taught about propagation of waves through solids, bulk modulus and so on in the lecture halls. Doing experiments like these are refreshing and bring perspective to the theory. Needless to say, I will still be focusing heavily on working with sensors.